matplotlib は非常に柔軟なシステムであり、ある機能を実現するための記述方法がいくつもある。 これは一見便利な機能ではあるが、初学者にとっては matplotlib がわかりにくい原因の一つとなっていると思われる。
そこで、少なくとも初心者のうちは、本稿に示す鉄則を守って matplotlib を使い始めることを勧める。
ax を取得する。fig, ax = plt.subplots(rows, cols, figsize=(width * cols, height * rows)) Parameters:
rows : 座標系の行数
cols : 座標系の列数
width : 各座標系の横幅 ($\times 100$ px)
height : 各座標系の縦幅 ($\times 100$ px)
Returns:
fig : Figure
ax : Axes
1要素 if rows == 1 and cols ==1
1次元配列 else if rows == 1 and cols ==1
2次元配列 else if rows > 1 and cols > 1
pltに対して行う。plt.show() plt.savefig() で行う。描画内容をファイルに保存するには、各座標系ではなく plt に対して行う。
デフォルトの解像度が低いので、
dpi=600 のように解像度を指定すること。
plt.savefig(filepath,dpi=dpi)
# sample code 1-1
%matplotlib inline

import matplotlib.pyplot as plt
import numpy as np

fig, ax = plt.subplots(1, 1, figsize=(8,6))
xs = [ 1, 2, 3, 4, 5 ]
ys = [ 2, 5, 3, 7, 4 ]

ax.plot(xs, ys)

plt.show()
最初の行の '%matplotlib inline' は jupyter notebook の中でグラフを表示するときに指定する命令で、「Webページ内にインラインで表示しろ」と指定している。
ax.plot(x座標の配列, y座標の配列)で折れ線グラフを描く。
plt.suplots() の関数呼び出しにおいて
rows か cols のどちらか一方だけが $1$ の場合は、ax に座標系 (Axes object) の1次元配列が返される。
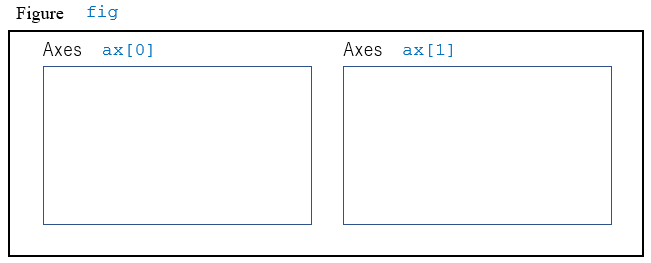
rows==1 and cols > 1 の場合は、横方向に配置される座標系が返される(sample code 1-2-1)。
fig, ax = plt.subplots(1, 2, ...)

# sample code 1-2-1
%matplotlib inline

import matplotlib.pyplot as plt
import numpy as np

fig, ax = plt.subplots(1,2, figsize=(8*2,6))
xs = [ 1, 2, 3, 4, 5 ]
ys = [ 2, 5, 3, 7, 4 ]

ax[0].plot(xs, ys)
ax[1].scatter(xs, ys, c='green')

plt.show()
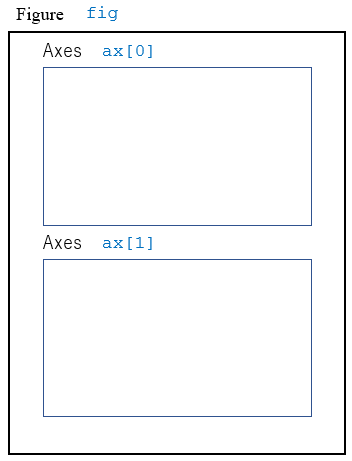
rows > 1 and cols == 0 の場合は、縦方向に配置される座標系が返される(sample code 1-2-2)。
fig, ax = plt.subplots(2, 1, ...)

# sample code 1-2-2
%matplotlib inline

import matplotlib.pyplot as plt
import numpy as np

fig, ax = plt.subplots(2, 1, figsize=(8, 6*2))
xs = [ 1, 2, 3, 4, 5 ]
ys = [ 2, 5, 3, 7, 4 ]

ax[0].plot(xs, ys)
ax[1].scatter(xs, ys, c='green')

plt.show()
plt.suplots() の関数呼び出しにおいて
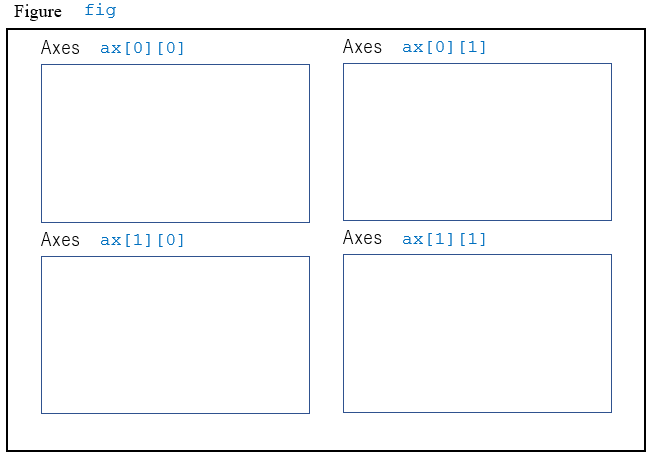
rows > 1 and cols > 1 の場合、ax には座標系 (Axes object) の2次元配列が返される。
fig, ax = plt.subplots(2, 2, ...)

# sample code 1-3
%matplotlib inline

import matplotlib.pyplot as plt
import numpy as np

fig, ax = plt.subplots(2, 2, figsize=(8*2, 6*2))
xs = [ 1, 2, 3, 4, 5 ]
ys = [ 2, 5, 3, 7, 4 ]
ys2 = [ 1, 4, 9, 16, 25 ]

ax[0][0].plot(xs, ys)
ax[0][1].plot(xs, ys2, c='red')
ax[1][0].scatter(xs, ys, c='green')
ax[1][1].scatter(xs, ys2, c='orange')

plt.show()
座標系 (Axes object)の間の間隔は
plt.subplots_adjust()
で設定する。縦方向は hspace パラメータで、
横方向は wspace パラメータで設定する。
座標系の下に文字を表示する空間を確保するので、
表示領域全体の大きさを縦方向に広げる必要がある。
そのため、
plt.suplots(..., figsize=(width, height))
の呼び出しで、
引数figsize パラメータに指定する height
を大きくする。
また、座標系間を縦方向に離して配置するために、
plt.subplots_adjust(hspace=height)
を呼び出す。
文字列の描画は、座標系に対して text(x, y, str, ha=..., transform=...) 関数で行う。
transform パラメータに各座標系の transAxesを設定することが重要である。
文字の位置は
x と y と ha で指定する。
# sample code 1-4
%matplotlib inline

import matplotlib.pyplot as plt
import numpy as np

VSKIP=0.3    # vertical space between Axes
rows = 2
cols = 2

fig, ax = plt.subplots(rows, cols, figsize=(8*cols, (6+VSKIP)*rows))
plt.subplots_adjust(hspace = VSKIP)   # make space vertically
for idx in range(rows * cols):
    row = idx // cols
    col = idx % cols
    ax[row][col].text(0.5, -0.15, f'Fig {idx}', fontsize=16, ha='center', transform=ax[row][col].transAxes)

xs = [ 1, 2, 3, 4, 5 ]
ys = [ 2, 5, 3, 7, 4 ]
ys2 = [ 1, 4, 9, 16, 25 ]

ax[0][0].plot(xs, ys)
ax[0][1].plot(xs, ys2, c='red')
ax[1][0].scatter(xs, ys, c='green')
ax[1][1].scatter(xs, ys2, c='orange')

plt.show()
保存する画像ファイルのパス (path) と、解像度 (dpi) を指定して、描画内容をファイルに保存する。 保存する画像ファイルのフォーマットはファイル名の拡張子で指定する。 sample code 1-5 では png 形式で保存している。
# sample code 1-5
%matplotlib inline

import matplotlib.pyplot as plt
import numpy as np

fig, ax = plt.subplots(2, 2,figsize=(8*2, 6*2))
xs = [ 1, 2, 3, 4, 5 ]
ys = [ 2, 5, 3, 7, 4 ]
ys2 = [ 1, 4, 9, 16, 25 ]

ax[0][0].plot(xs, ys)
ax[0][1].plot(xs, ys2, c='red')
ax[1][0].scatter(xs, ys, c='green')
ax[1][1].scatter(xs, ys2, c='orange')

plt.savefig('./sample-1-4.png', dpi=600)
plt.close()
# ファイルを確認する。
import os
if os.name == 'nt':
    LS = 'dir'
    LS_R = 'dir /s'
else:
    LS = 'ls -l'
    LS_R = 'ls -lR'


!{LS} ./sample-1-4.png
-rw-r--r-- 1 root root 572527 Mar 28 13:35 ./sample-1-4.png