matplotlib tutorial (1) nitta@tsuda.ac.jp

matplotlib is a very flexible system, and there are many ways to write it to achive a certain function. This is a useful feature at first glance, but it seems to be one of the reasons why matplotlib is confusing for beginners.

Therefore, at least for beginners, we recommend that you follow the rules in this article and start using matplotlib.

Rule [1]: First, create the required number of coordinate systems (Axes) at once.

Firt, get the required number of coordinate systems (Axes) ax with the following code.
fig, ax = plt.subplots(rows, cols, figsize=(width * cols, height * rows))

Parameters:
     rows : number of rows of the coordinate system
     cols : number of columns of the coordinate system
     width : width of each coordinate system ($\times 100$ px)
     height : height of each coordinate system ($\times 100$ px)
Returns:
     fig : Figure
     ax : Axes
        1 element    if rows == 1 and cols ==1
        1-dimensional array    else if rows == 1 and cols ==1
        2-dimensional array    else if rows > 1 and cols > 1

Rul [2]: Drawing is done for each coordinate system (Axes). That is, use the drawing functions and axis setting functions of the Axes object.

Rule [3]: To display the contents drawn in each coordinate system (Axes) on the screen, use plt.show() only once at the end.

To display the drawing contents on the screen, do it for plt, not for each coordinate system.
plt.show()

Rule [4]: To save the contents drawn in each coordinate system (Axes) to a file, specify the resolution and use plt.savefig().

To save the drawing contents to a file, do it for plt instead of each coordinate system. The default resolution is low, so specify a resolution such as dpi=6400.
plt.savefig(filepath,dpi=dpi)

Chapter 1: Understanding the Coordinate System (Axes Object)

1-1: When ax is one coordinate system

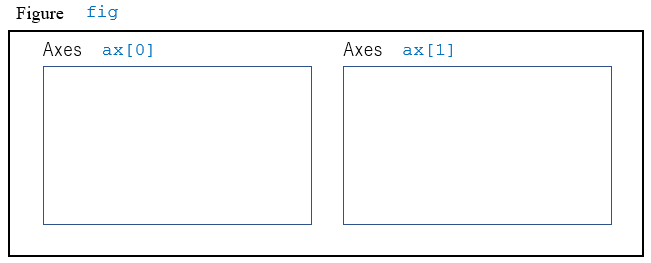
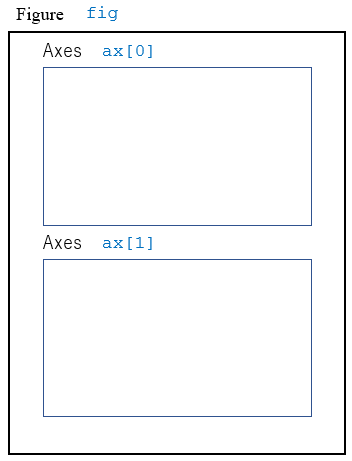
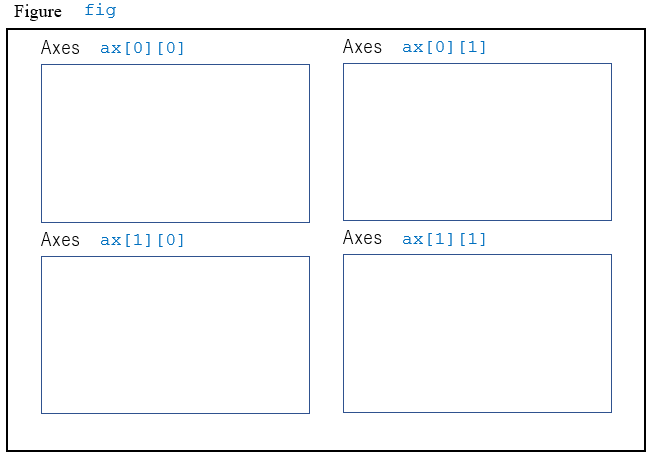
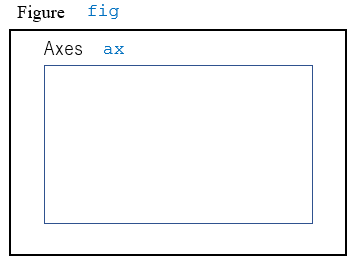
If rows == 1 and cols == 1 in the function call of plt.subplots(), one coordinate system (Axes object) is returned to ax, so drawing commands are issued for this ax.

fig, ax = plt.subplots(1, 1, ...)


Finally, plt.show() draws it inline in the jupyter notebook page.

THe first line, '% matplotlib inline', is the instruction you specify when displaying the graph in the current page of jupyter notebook, which specifies "display inline in the web page".

Draw a broken line graph with ax.plot(an_array_of_x_coordinates, an_array_of_y_coordinates).

1-2: When ax is a 1-dimensional array of coordinate systems

if only one of rows or cols is 1 in the function call of plt.subplots(), 1-dimensional array of Axes objects is returned and assigned to ax.

if rows==1 and cols > 1, horizontally aligned coordinate systems are returned (sample code 1-2-1)。

fig, ax = plt.subplots(1, 2, ...)


If rows > 1 and cols == 0, vertically aligned coordinate systems are returned (sample code 1-2-2)。

fig, ax = plt.subplots(2, 1, ...)


1-3: When is a 2-Dimensional Array of Coordinate Systems

if rows > 1 and cols > 1 in the function call plt.suplots(), 2-dimensional array of coordinate systems (Axes) and assigned to ax.

fig, ax = plt.subplots(2, 2, ...)


1-4: Display a string at the bottom of each coordinate system (Axes)

The spacing between Axes objects is set with plt.subplots_adjust(). The vertical direction is set by the hspace parameter, and the horizontal direction is set by the wspace parameter.

In order to secure a space for displaying characters under the coordinate system, it is necessary to expand the size of the entire display area in the vertical direction. Therefore, in the call to plt.suplots(..., figsize=(width, height)), increase the height spacified in the argument figsize parameter.

Also, call plt.suplots_adjust(hspace=height) to arrange the coordinate systems verticall apart.

The drawing of the character string is performed by the text(x, y, str, ha=..., transform=...) function for the corrdinate system. It is important to set the transform parameter to transAxes for each coordinate system. The character position is specified by x, y, and ha.

1-5: Save an image (Figure) that summarizes the contents drawn in each coordinate system (Axes) to a file

Specify the path (path) and resolution (dpi) of the image file to be saved, and save the drawing contents to the file. The format of the image file to be saved is specified by the extension of the file name. In sample code 1-5, it is saved in png format.