下の実行例では、最初の Axes の追加では [left, bottom, width, height] = [0.1, 0.1, 0.8, 0.8]
と指定しているので、図中の青の Axes の配置となる。
2番目の Axes の追加では [left, bottom, width, height] = [0.6, 0.2, 0.4, 0.3] と指定しているので、図中の緑の Axes の配置となる。
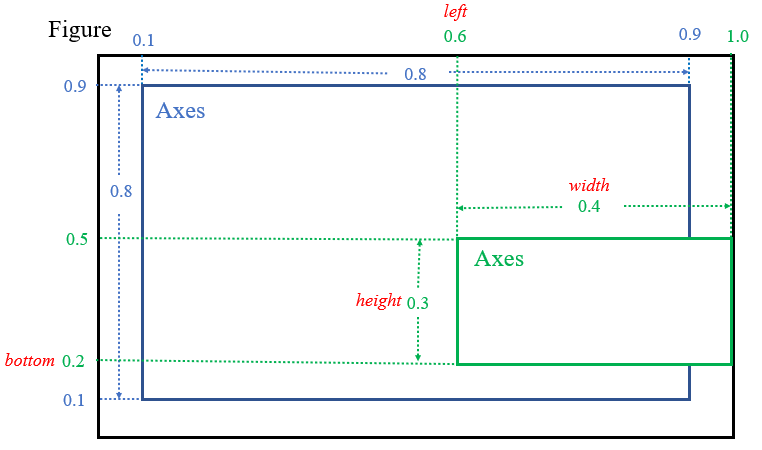
figure を作成するのと同時に Axes を必要な個数だけ作成してしまう書き方を薦めるが、変わった Axes を作成したり、Axesを変わった配置にしたい場合は、まず figure() で、必要な大きさの Figure を作成する。
matplotlib.figure.Figure(*args, **kwargs)
  [Parameters]
    figsize=(6.4, 4.8) :  (width, height) dimension in inches
    dpi=100 : dots per inch
  [Returns]
    Artist: the added artist
それから、figure.add_axes(rect=[left, bottom, width, height]) で好きな位置に Axes を配置していく。
matplotlib.figure.Figure.add_axes(self, *args, **kwargs)
  [Parameters]
    rect: [left, bottom, width, height]
    projection: projection types
    sharex, sharey: share x or y axis
    label: label for the returned axes
  [Returns]
    axes
下の実行例では、最初の Axes の追加では [left, bottom, width, height] = [0.1, 0.1, 0.8, 0.8]
と指定しているので、図中の青の Axes の配置となる。
2番目の Axes の追加では [left, bottom, width, height] = [0.6, 0.2, 0.4, 0.3] と指定しているので、図中の緑の Axes の配置となる。
is_colab = 'google.colab' in str(get_ipython()) # for Google Colab
%matplotlib inline
import matplotlib.pyplot as plt
import numpy as np

x = np.linspace(-2, 3, 10)
y1 = x
y2 = x ** 2

fig = plt.figure(figsize=(5, 4))
ax = fig.add_axes([0.1, 0.1, 0.8, 0.8])
ax.scatter(x, y1)

ax2 = fig.add_axes([0.6, 0.2, 0.4, 0.3])
ax2.scatter(x, y2)

plt.show()
