matplotlib tutorial (15) nitta@tsuda.ac.jp
Basically it is recommended to generate as many Axes as you need at the same time as creating the figure.
However, if you want to create a weird Axes or have an Axes in a weird arrangement, first create a figure of the required size with figure().
matplotlib.figure.Figure(*args, **kwargs)
  [Parameters]
    figsize=(6.4, 4.8) :  (width, height) dimension in inches
    dpi=100 : dots per inch
  [Returns]
    Artist: the added artist
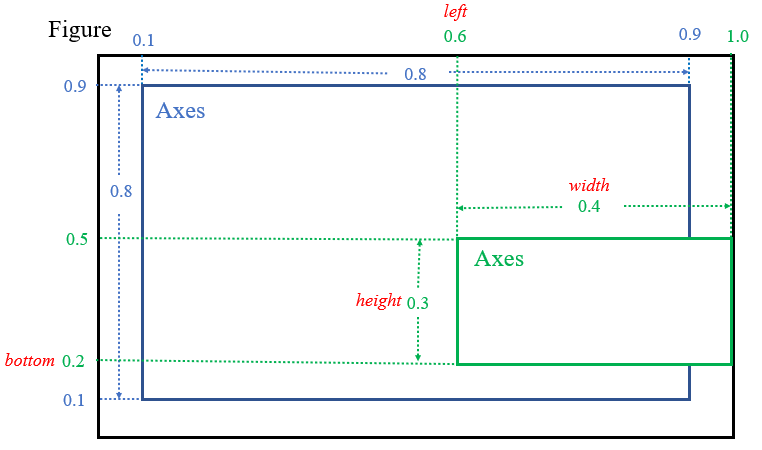
Then use figure.add_axes(rect=[left, bottom, width, height]) to place new Axes in any position you like.
matplotlib.figure.Figure.add_axes(self, *args, **kwargs)
  [Parameters]
    rect: [left, bottom, width, height]
    projection: projection types
    sharex, sharey: share x or y axis
    label: label for the returned axes
  [Returns]
    axes